Iostat (input/output statistics) is a computer system monitor tool used to collect and show operating system storage input and output statistics. It is often used to identify performance issues with storage devices, including local disks, or remote disks accessed over network file systems such as NFS. It can also be used to provide information about terminal (TTY) input and output.
The iostat command is used for monitoring system input/output device loading by observing the time the devices are active in relation to their average transfer rates. The iostat command generates reports that can be used to change system configuration to better balance the input/output load between physical disks.
The first report generated by the iostat command provides statistics concerning the time since the system was booted. Each subsequent report covers the time since the previous report. All statistics are reported each time the iostat command is run. The report consists of a CPU header row followed by a row of CPU statistics. On multiprocessor systems, CPU statistics are calculated system-wide as averages among all processors. A device header row is displayed followed by a line of statistics for each device that is configured. When option -n is used, an NFS header row is displayed followed by a line of statistics for each network filesystem that is mounted.
The interval parameter specifies the amount of time in seconds between each report. The first report contains statistics for the time since system startup (boot). Each subsequent report contains statistics collected during the interval since the previous report. The count parameter can be specified in conjunction with the interval parameter. If the count parameter is specified, the value of count determines the number of reports generated at interval seconds apart. If the interval parameter is specified without the count parameter, the iostat command generates reports continuously.
Syntax and availability
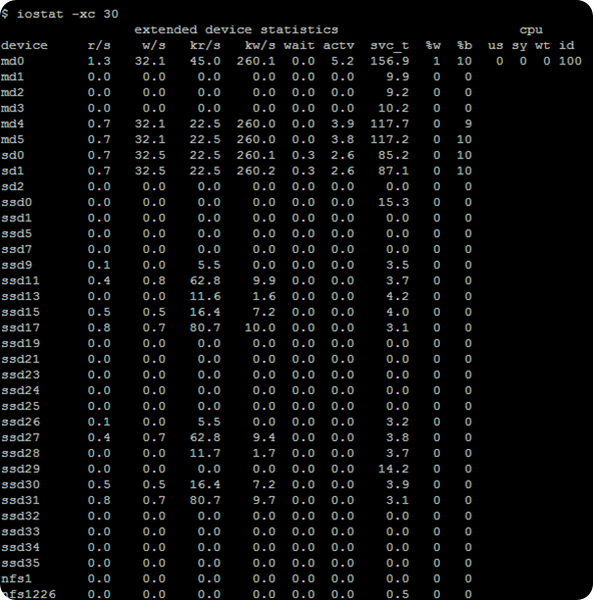
On a Solaris 10 system with numerous attached I/O devices iostat -x displays output where each line (row) gives numerical data for one device. The first column lists the device name, and subsequent columns show various statistics for that device. Columns include the average service time (svc_t, which includes not only the time a request is in the service queue, but also the seek time and transfer time), the average busy percentage (%b, essentially the proportion of time that the device is in use), and the percentage of time that the queue is not empty (%w, which means the proportion of time in which requests from the device have not yet been fulfilled).
It is best to run iostat specifying a time interval in seconds (for example iostat -x 30) in order to see the results over time. This is because otherwise, the output will reflect the values over the entire timespan since the system was last rebooted.
The iostat tool is available on most UNIX and Unix-like operating systems, such as FreeBSD, Linux and Solaris. The syntax and output of iostat often differs slightly between them.

Output of the command.
Sun Microsystems stated that high values in the wait and svc_t fields suggest a lack of overall throughput in the system, indicating that "the system is overloaded with I/O operations". Consistently high values in the kr/s, kw/s, %w and %b fields also indicate "a possible I/O bottleneck".
In versions of Solaris before Solaris 7, iostat can give misleading information in the wait field on multiprocessor systems. This is because iostat can misinterpret one processor being in a state where it is waiting for I/O, as meaning that all processors in the system are having to wait.
It is also advisable to disregard high values in the svc_t field for disks that have very low rates of activity (less than 5%). This is because the fsflush process can force up the average service time when synchronising data on disk with what is in memory.
For systems where a volume manager is used, for example Veritas Volume Manager, iostat does not display information about the individual volumes on each disk. The vxstat command can be used to show this information instead.
The iostat command is used for monitoring system input/output device loading by observing the time the devices are active in relation to their average transfer rates. The iostat command generates reports that can be used to change system configuration to better balance the input/output load between physical disks.
The first report generated by the iostat command provides statistics concerning the time since the system was booted. Each subsequent report covers the time since the previous report. All statistics are reported each time the iostat command is run. The report consists of a CPU header row followed by a row of CPU statistics. On multiprocessor systems, CPU statistics are calculated system-wide as averages among all processors. A device header row is displayed followed by a line of statistics for each device that is configured. When option -n is used, an NFS header row is displayed followed by a line of statistics for each network filesystem that is mounted.
The interval parameter specifies the amount of time in seconds between each report. The first report contains statistics for the time since system startup (boot). Each subsequent report contains statistics collected during the interval since the previous report. The count parameter can be specified in conjunction with the interval parameter. If the count parameter is specified, the value of count determines the number of reports generated at interval seconds apart. If the interval parameter is specified without the count parameter, the iostat command generates reports continuously.
Syntax and availability
On a Solaris 10 system with numerous attached I/O devices iostat -x displays output where each line (row) gives numerical data for one device. The first column lists the device name, and subsequent columns show various statistics for that device. Columns include the average service time (svc_t, which includes not only the time a request is in the service queue, but also the seek time and transfer time), the average busy percentage (%b, essentially the proportion of time that the device is in use), and the percentage of time that the queue is not empty (%w, which means the proportion of time in which requests from the device have not yet been fulfilled).
It is best to run iostat specifying a time interval in seconds (for example iostat -x 30) in order to see the results over time. This is because otherwise, the output will reflect the values over the entire timespan since the system was last rebooted.
The iostat tool is available on most UNIX and Unix-like operating systems, such as FreeBSD, Linux and Solaris. The syntax and output of iostat often differs slightly between them.

Output of the command.
Sun Microsystems stated that high values in the wait and svc_t fields suggest a lack of overall throughput in the system, indicating that "the system is overloaded with I/O operations". Consistently high values in the kr/s, kw/s, %w and %b fields also indicate "a possible I/O bottleneck".
In versions of Solaris before Solaris 7, iostat can give misleading information in the wait field on multiprocessor systems. This is because iostat can misinterpret one processor being in a state where it is waiting for I/O, as meaning that all processors in the system are having to wait.
It is also advisable to disregard high values in the svc_t field for disks that have very low rates of activity (less than 5%). This is because the fsflush process can force up the average service time when synchronising data on disk with what is in memory.
For systems where a volume manager is used, for example Veritas Volume Manager, iostat does not display information about the individual volumes on each disk. The vxstat command can be used to show this information instead.
If you liked this article, subscribe to the feed by clicking the image below to keep informed about new contents of the blog:


0 commenti:
Post a Comment